Waveform Display#
At a Glance
Parameters: Unlimited
X-Axis: Time or Distance
Key Features: Multiple cursors, statistics, events, zoom
Best For: Time-series analysis, multi-session comparison
The Waveform Display plots multiple parameters as traces against time or distance. It's the most versatile display in ATLAS, supporting live telemetry and historical sessions, fast zooming, and rich formatting. Use it for:
- Braking/throttle application vs. speed, per corner or lap
- Multi-session comparisons with Time Difference (TDiff) in Distance mode
- Event-driven triage (ECU events/errors) aligned to timestamps or distances
When to Use Waveform Display#
 Driver analysis: Brake/throttle application vs. speed per corner
 Multi-session comparison: Compare different laps or sessions side-by-side
 Event investigation: See telemetry context around ECU events
 Trend analysis: Identify patterns over time or distance
 Live monitoring: Watch real-time telemetry streams
Adding a Waveform Display#
Press Ctrl+Q twice, type "Waveform", press Enter
 Fastest method
Click the Waveform icon on the Display Toolbar
 One click when you know the icon
File > New > Display > Waveform Display
 Browse all options
Parameter Selection#
- Use Parameter Browser (default max 100 parameters, configurable)
- Double-click legend items for Parameter Properties (supports single/multi-session editing)
Compare Sets#
- Load multiple sessions into a set
- Switch sets:
Shift+<n>(selected display),Ctrl+<n>(whole page), or click coloured tag on title bar
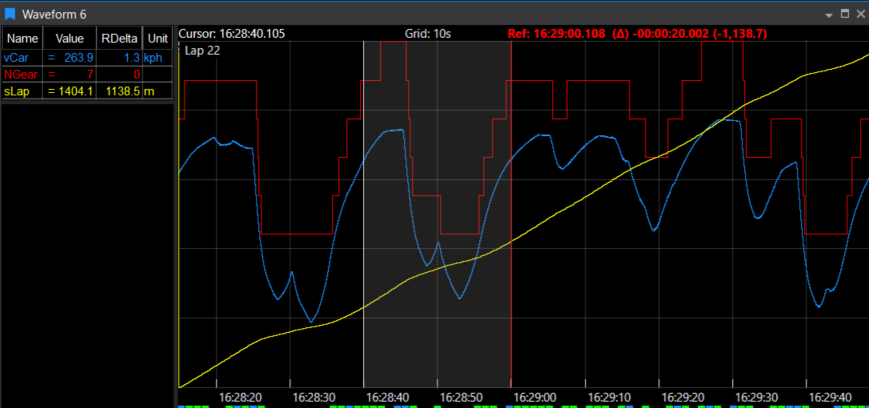
Display Anatomy#
Plot Area#
- One coloured trace per parameter
- Grid (vertical/horizontal/both) with adjustable spacing (shown at top of plot)
- Cursor line showing current position
- Cursor text at top-left (shows Time, and Distance in Distance mode)
- X-axis showing time or distance
- Event markers below X-axis (coloured squares)
Legend#
- One row per parameter with cursor value and statistics
- Colour bar matches trace colour
- Click rows to select parameters
- Reposition, resize, grid, show units, toggle headers
- Select rows (
Ctrl/Shift) to highlight traces and perform actions (hide/delete/distribute)
Axes#
- X-Axis: Time (default) or Distance (press
Kto switch) - Y-Axis: Per-parameter scales (enable in Parameter Properties)
Key Features#
Cursors#
Cursor Modes (View menu or shortcuts):
| Mode | Key | Description |
|---|---|---|
| Value | V |
Vertical line, shows sample values (default) |
| Crosshair | C |
Adds horizontal sight line |
| Gradient | G |
Diagonal line with three handles; legend shows per-signal gradient |
| Hide | N |
Turn off cursor display |
Reference Cursor
Press R to add a red reference line for comparison.
Features:
- Red reference line; grey window between reference and current cursor defines analysis range
- Legend shows ΔTime/ΔDistance and computes statistics for that window
- Drag either cursor to adjust window size

Statistics#
Enable statistics to see parameter behaviour over ranges:
Setup Steps
- Check Show Statistics in Display Properties
- Choose your Statistics Level
- Toggle metrics with keyboard shortcuts
Statistics Levels:
| Level | Scope | Prefix |
|---|---|---|
| Display | Visible timebase | D |
| Lap | Current lap only | L |
| Session | Entire session | S |
| All | All loaded sessions | A |
Reference Cursor can have its own level or swap with the chosen level.
Available Metrics:
| Metric | Key | Description |
|---|---|---|
| Min | M |
Minimum value |
| Max | X |
Maximum value |
| Mean | N |
Average value |
| Delta | E |
Difference between cursors |
| Std Dev | Q |
Standard deviation |
Reading Statistics
Statistics appear in legend with prefixes: LMin (Lap Min), SMax (Session Max), etc.
Selecting, Highlighting, Hiding Parameters#
Select Parameters:
- Click legend row to select one parameter
Ctrl+Click: Add to selectionShift+Click: Select range- Selected traces flash (by default)
Hide Selected Parameters:
- Hides traces but keeps legend entries
- Names shown with strikethrough
- Values shown in italics
- Unhide by selecting and pressing Hide again
Delete Selected Parameters:
- Removes parameters completely from display
Distribute:
- Stacks selected traces into separate bands
- Useful for avoiding overlapping traces
- Reset Distribute: Returns to normal view
Autoscale:
- Fits selected parameters to available vertical space
- Reset Auto-Scale: Returns to original scaling
Events and Markers#
Event Indicators:
Event Colours
Coloured squares below X-axis indicate event severity:
 Red: High priority events
 Blue: Medium priority events
 Green: Low priority events
Features:
- Hover for event details
- Multiple events at same position show highest priority colour
- Mask/unmask events by hovering and right-clicking
- View masked events via context menu
Other Markers:
| Marker Type | Description | Toggle |
|---|---|---|
| Lap Markers | Vertical dashed lines at lap boundaries | Display Properties |
| Date/Time Markers | Clock time or lap time on X-axis | Time mode only |
| Circuit Stripe | Track sectors/segments across top of plot; toggle labels; choose global/overridden Circuit Definition | Display Properties |
Zoom and Navigation#
Zoom Box:
- Click and drag to create zoom region
- Top-to-bottom: Zoom X and Y axes
- Bottom-to-top: Zoom X-axis only (zoom strip)
- Mouse wheel: Zoom X-axis (time/distance)
- Toolbar zoom buttons
Autoscroll (Live Sessions):
- Middle mouse button (or both buttons)
- Pointer position controls scroll speed
- Click to exit autoscroll mode
Pause/Inspect:
- Single-click plot to pause scrolling and position cursor
- Double-click to resume scrolling
Time vs. Distance Mode#
Press K to cycle between X-axis mappings:
- Time Mode: X-axis shows elapsed time
- Distance Mode: X-axis shows distance travelled
Time Difference (TDiff) in Distance Mode:
- Plots time difference between sessions
- Shows which session is ahead/behind at each distance
- Enable Show Time Diff in Display Properties
- Choose TDiff start point:
- Start of lap
- Current cursor position
Sampling and Interpolation#
Sub-Sampling (when cursor spans multiple samples):
Choose how to display data:
- First: Show first sample value
- Min: Show minimum in range
- Max: Show maximum in range
- Mean: Show average
- Min→Max: Draw vertical line from min to max
- Max→Min: Draw vertical line from max to min
Legend shows min/max values; trace shows vertical min-max line.
Interpolation:
- Enable Interpolate between samples (Parameter Properties > Post Processing) to smooth traces and generate interpolated legend values
- Makes stepped traces appear smoother
Session Comparison#
Show Differences:
- Displays value difference between sessions at cursor
- Enable in Parameter Properties > Post Processing
- Pause live scrolling for readability
- Not available for:
- Boolean or Text parameters
- Functions
- When using Filters or Trends
Left-to-Right Mode (Strip Chart)#
For live telemetry analysis:
- Enable Draw left to right in Display Properties
- Traces overwrite from left as laps progress
- Set Gap % to add gap ahead of cursor
- Choose Left to Right Overlay lap for reference
Useful for comparing current lap against previous laps in real-time.
Live Telemetry & Historical Replay#
- Live: Waveform scrolls/updates if a live session is in the set
- Historical Replay: Enable Allow Historical Replay; double-click plot to replay
Keyboard Shortcuts#
Cursor Modes#
| Key | Action |
|---|---|
V |
Value cursor mode |
C |
Crosshair cursor mode |
G |
Gradient cursor mode |
N |
Hide cursor |
R |
Toggle reference cursor |
Statistics#
| Key | Action |
|---|---|
M |
Toggle Min statistic |
X |
Toggle Max statistic |
N |
Toggle Mean statistic |
E |
Toggle Delta statistic |
Q |
Toggle Std Dev statistic |
Navigation#
| Key | Action |
|---|---|
K |
Cycle X-axis mode (Time/Distance) |
D |
Display Properties |
← / → |
Move cursor |
Shift+← / Shift+→ |
Move cursor faster |
Home |
Cursor to start |
End |
Cursor to end |
Compare Sets#
| Key | Action |
|---|---|
Shift+<n> |
Switch set (selected display) |
Ctrl+<n> |
Switch set (whole page) |
Display Properties#
Key properties you can configure:
General#
- Background colour
- Show grid (horizontal, vertical, both)
- Grid spacing
- Show title bar
- Allow historical replay
Legend#
- Position (top, bottom, left, right)
- Font size
- Show units
- Show warning indicators
- Value alignment
Cursor & Statistics#
- Cursor mode (Value, Crosshair, Gradient)
- Show statistics
- Statistics level
- Reference cursor level
Time/Distance#
- X-axis mode
- Show time difference
- TDiff start point
- Time notation format
Events#
- Show event indicators
- Show lap markers
- Show date/time markers
- Circuit stripe visibility
Sub-Sampling#
- Drawing mode (First, Min, Max, Mean, etc.)
- Interpolate between samples
Example Configurations#
Analyse brake/throttle inputs:
- Add Waveform Display
- Add Brake, Throttle, Speed parameters
- Use Distribute to stack traces
- Switch to Distance mode (
K) - Add Reference Cursor (
R) to compare corners
Perfect for: Corner-by-corner driver analysis
Compare laps side-by-side:
- Load multiple sessions
- Switch to Distance mode (
K) - Enable Show Time Diff
- Use Show Differences for value deltas
Perfect for: Lap comparison and performance progression
Real-time telemetry view:
- Connect live session
- Enable Draw left to right (strip chart mode)
- Set Gap % ahead of cursor
- Choose overlay lap for reference
Perfect for: Pit wall and live engineering
Tips & Tricks#
Parameter Management
 Too many parameters? Use Distribute to stack traces vertically
 Can't see parameter? Use Autoscale to fit to screen
Analysis
 Comparing laps? Use Reference Cursor to compare two points
 Analysing events? Event markers show when things happened
Visualisation
Stepped signals? Enable interpolation for smoother traces
Large dataset? Zoom in to see detail, zoom out for overview
 Multi-session comparison? Use Time Diff in Distance mode
 Track context? Enable Circuit Stripe to see where on track
Troubleshooting#
No Y-axis scales showing?
Enable per-parameter Y-Scale in Parameter Properties.
Traces overlapping and hard to read?
- Use Distribute function to stack traces into bands
- Reduce number of visible parameters
- Hide less important parameters temporarily
- Use Autoscale to fit data to vertical space
Event markers not showing?
- Check Show Event Indicators is enabled in Display Properties
- Verify events aren't masked in Event Filter Display
- Check event priorities are visible
Differences not showing?
"Show Differences" not available with:
- Filters, Trends, or Functions
- Boolean/Text parameters
- During live scrolling (pause to read values)
Cursor not moving?
- Click to focus the waveform display
- Check keyboard focus is on the display
Stepped signals look wrong?
Consider enabling Interpolate between samples in Parameter Properties > Post Processing if interpolation is appropriate for the signal type.
Missing event markers?
Ensure Show Event Indicators is on; check Event Filters for masked priorities.