Numeric Display#
At a Glance
Parameters: Up to 150
Layout: Auto-sizing grid
Key Features: Colour thresholds, hex formatting, status indicators
Best For: Dashboards, live monitoring, quick inspection
The Numeric Display shows instant numeric readouts for up to 150 parameters at the cursor position. Text auto-sizes to fit the display window, and colours can reflect warning/critical thresholds. Double-click a value to edit that parameter's properties.
When to Use Numeric Display#
 Live monitoring: Watch current values during recording
 Dashboard creation: Build custom parameter dashboards
 Quick inspection: Check exact values at any cursor position
 Status monitoring: Use colour thresholds to highlight issues
 Parameter comparison: View multiple related parameters together
Adding a Numeric Display#
To add a Numeric Display to a page, choose one of the following methods:
- Toolbar: Click the Numeric Display button on the Display Toolbar.
- Menu: Go to File > New > Display and select Numeric Display.
- Shortcut: Press
Ctrl+Qtwice to open the Quick Access Assistant, type "Numeric", and select New Numeric Display.
Once added, use the Parameter Browser to add parameters and configure the display as needed.
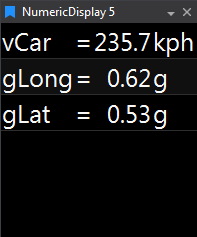
Display Anatomy#
The Numeric Display shows a grid of parameters with:
- Parameter name (optional)
- Current value (at cursor position)
- Units (optional)
- Colour highlighting based on thresholds
Text size automatically adjusts to fit the available space.
Key Features#
Auto-Sizing Layout#
The display automatically:
- Calculates optimal text size based on window size
- Arranges parameters in a grid
- Adjusts when you resize the window
- Fills available space efficiently
You can override auto-sizing with fixed font size if preferred.
Colour Thresholds#
Parameters can show different colours based on their values:
Normal
Default text colour (typically white)
Warning
Text colour changes when a value enters its warning range
Critical
Uses critical colour (default red) for critical values
Non-Critical
If critical is disabled, non-critical values use the selected colour (default blue)
Configuration
Set warning and critical ranges for each parameter in the Appearance section of the Parameter Properties panel.
Flexible Formatting#
Control what's displayed for each parameter:
- Show/hide parameter name
- Show/hide description
- Show/hide numeric value
- Show/hide units
- Show/hide sign (+ or -)
- Show/hide status indicator
Status Indicators#
Parameters can display status symbols:
- Up arrow: Value increasing
- Down arrow: Value decreasing
- Warning symbol: In warning range
- Critical symbol: In critical range
Hex Formatting#
For parameters displayed in hexadecimal:
- Option to show "0x" prefix
- Configurable uppercase/lowercase
- Full hex formatting control
Grid Overlay#
Optional grid lines between parameters:
- Show/hide grid
- Custom grid colour
- Adjustable padding around items
- Column spacing control
Display Properties#
Text Formatting#
Font Family: Choose from available system fonts
Font Size:
- Auto: Automatically scales to fit window (recommended)
- Fixed: Specify exact point size
Alignment:
- Name alignment (Left, Center, Right)
- Value alignment (Left, Center, Right)
Visibility:
- Show parameter name
- Show parameter description
- Show value
- Show units
- Show sign (+ or -)
- Show status indicator
Colour Options#
Text Colouring:
- Single colour for all: All parameters use same text colour
- Individual colours: Each parameter uses its own colour
- Apply critical/warning to text: Threshold colours affect text colour
Background Colouring:
- Display background: Overall display background colour
- Apply critical/warning to background: Threshold colours affect background
- Selected item colours: Foreground and background for selected parameters
Note: Critical/warning colours can apply to text OR background, not both simultaneously.
Grid and Layout#
- Show grid: Enable/disable grid lines between parameters
- Grid colour: Colour of grid lines
- Column padding: Space between columns
- Item padding: Space around each parameter
Data Update#
- Refresh rate: Update frequency in Hz (1-1000 Hz)
- Auto-refresh: Enable continuous updates
Adding Parameters#
After creating a Numeric Display:
- Open Parameter Browser (
Ctrl+P) - Find the parameters you want to monitor
- Drag parameters onto the display, or
- Select parameters and Add to Display
You can add up to 150 parameters.
Editing Parameter Properties#
Double-click any parameter value to open its Parameter Properties panel where you can:
- Change parameter colour
- Set warning/critical thresholds
- Adjust decimal places
- Change display format (decimal, hex, scientific)
- Set custom units
- Enable/disable features per parameter
Working with Parameters#
Selecting Parameters#
- Click a parameter to select it
- Selected parameters show highlighted background
Ctrl+Click: Add to selectionShift+Click: Select range
Reordering Parameters#
Drag parameters to reorder them within the grid.
Removing Parameters#
- Select parameter(s)
- Press
Deletekey, or - Right-click > Remove Parameter
Copying Values#
Copy to Clipboard:
- Right-click > Copy (for selected parameters)
- Right-click > Copy All
Values copied as tab-delimited text, suitable for pasting into Excel or other tools.
Snapshot Export#
Export current display values to file:
- Right-click display
- Select "Snapshot to File"
- Choose format and location
Keyboard Shortcuts#
| Key | Action |
|---|---|
D |
Display Properties |
Delete |
Remove selected parameters |
Ctrl+C |
Copy selected values |
Ctrl+A |
Select all parameters |
↑/↓/←/→ |
Navigate selection |
Example Configurations#
Create a clean monitoring dashboard:
- Set Show parameter name: ON
- Set Show value: ON
- Set Show units: ON
- Set Show description: OFF
- Enable Apply critical/warning to text
- Set appropriate thresholds
Perfect for: Live monitoring stations
Show just the numbers:
- Set Show parameter name: OFF
- Set Show value: ON
- Set Show units: OFF
- Use Individual colours for differentiation
- Disable Show status indicator
- Hide grid for cleaner look
 Perfect for: Dense parameter grids
Highlight issues immediately:
- Enable Apply critical/warning to background
- Set Display background: Dark colour
- Configure warning/critical thresholds
- Enable Show status indicator
- Use Auto font size for visibility
Perfect for: Alert dashboards
Tips & Tricks#
Layout Optimization
 Dashboard creation: Use Numeric Display as main dashboard component
 Colour coding: Set up threshold colours to instantly spot issues
 Live monitoring: Keep refresh rate reasonable (20-60 Hz) to avoid flicker
Data Display
Hex values: Great for displaying status words and bit fields
Quick check: Add Numeric Display temporarily to inspect specific values
 Multi-monitor: Float Numeric Display on second monitor for live monitoring
 Parameter grouping: Group related parameters for easier monitoring
Troubleshooting#
Text too small to read?
- Reduce number of parameters
- Increase window size
- Use fixed font size instead of auto
Text too large?
- Add more parameters to fill space
- Use fixed font size and reduce point size
Colours not showing?
- Check warning/critical thresholds are configured in Parameter Properties
- Verify "Apply critical/warning" option is enabled
- Check text vs background colour application setting
Values not updating?
- Check refresh rate is appropriate
- Verify session is loaded and active
- Check cursor is moving (if not live)
Parameter disappeared?
May have been deleted instead of hidden. Re-add from Parameter Browser.